Visuafy : Online tool to make charts without code.

Visuafy: in summary
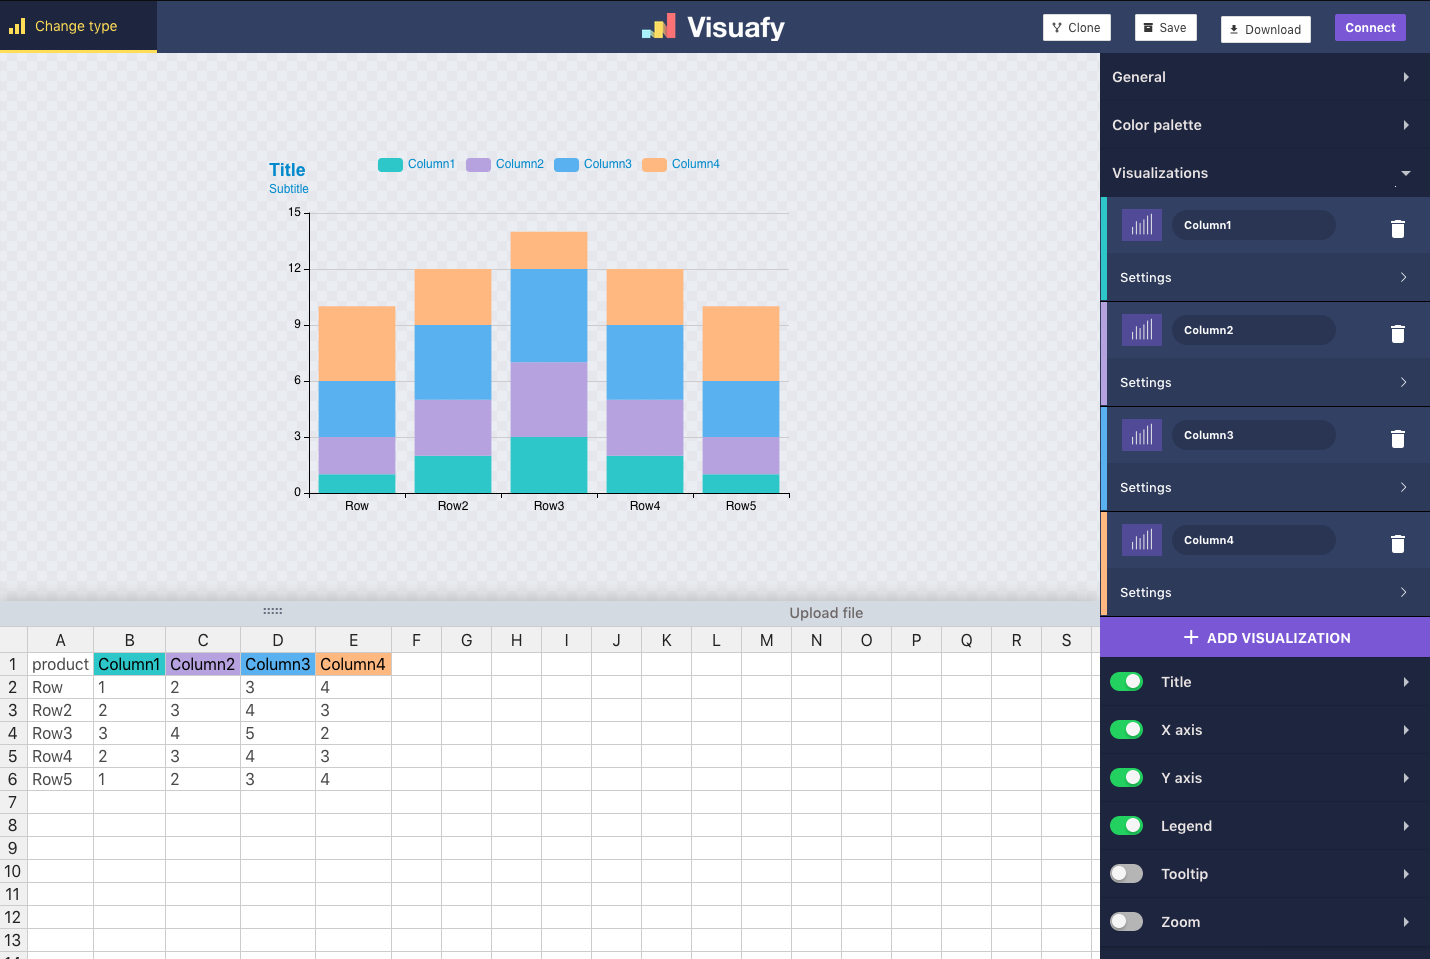
Visuafy is a tool created for designers, journalists and students to create statistical graphs easily in a few minutes.
It's really easy to use it, you can copy paste from excel or upload your own excel/.csv file directly.
You can generate various types of charts (line, bar, pie, scatter, polar ...) to find the perfect fit for your data.
You can download it as .jpg, .png or .pdf and use it wharever you want.
An embed option is also available with an interactive chart to put on your website or blog.

Visuafy: its rates
Estándar
Free
Basics
€9.90
/month /unlimited users
Essentials
€15.90
/month /unlimited users
Clients alternatives to Visuafy
Analyze network data with advanced visualization tools.
See more details See less details
Our data visualization software allows you to monitor network traffic, identify anomalies, and troubleshoot issues quickly with real-time dashboards and custom reports.
Read our analysis about Nagios Network AnalzyerCreate stunning visualizations with our data visualization software.
See more details See less details
Xtensio allows you to easily customize charts, diagrams, and infographics to clearly communicate complex data sets. With drag-and-drop functionality and a variety of templates, you can create professional-looking visualizations in minutes.
Read our analysis about XtensioCreate stunning visual representations of your data with our powerful data visualization software.
See more details See less details
Our software offers a wide range of customization options to help you create unique and interactive charts, graphs, and dashboards. With real-time data updates and seamless integration with other applications, you can easily share your visualizations with your team and clients.
Read our analysis about ZingChart Appvizer Community Reviews (0) The reviews left on Appvizer are verified by our team to ensure the authenticity of their submitters.
Write a review No reviews, be the first to submit yours.