Zola Analytics : Finance Research Assistant

Zola Analytics: in summary
Zola is a unified financial data and analytics platform designed to help professionals—especially in finance, investment, and research roles—transform complex data into publication-ready charts in seconds. Built to replace traditional, fragmented workflows that rely heavily on Excel and PowerPoint, Zola centralizes macroeconomic and financial data, enabling teams to query, visualize, and share insights effortlessly using natural language and AI agents.
Tailored for investment analysts, strategists, advisors, and client-facing teams, Zola focuses on accelerating the speed from data to decision, removing technical barriers without compromising data quality or visual clarity.
What are the main features of Zola?
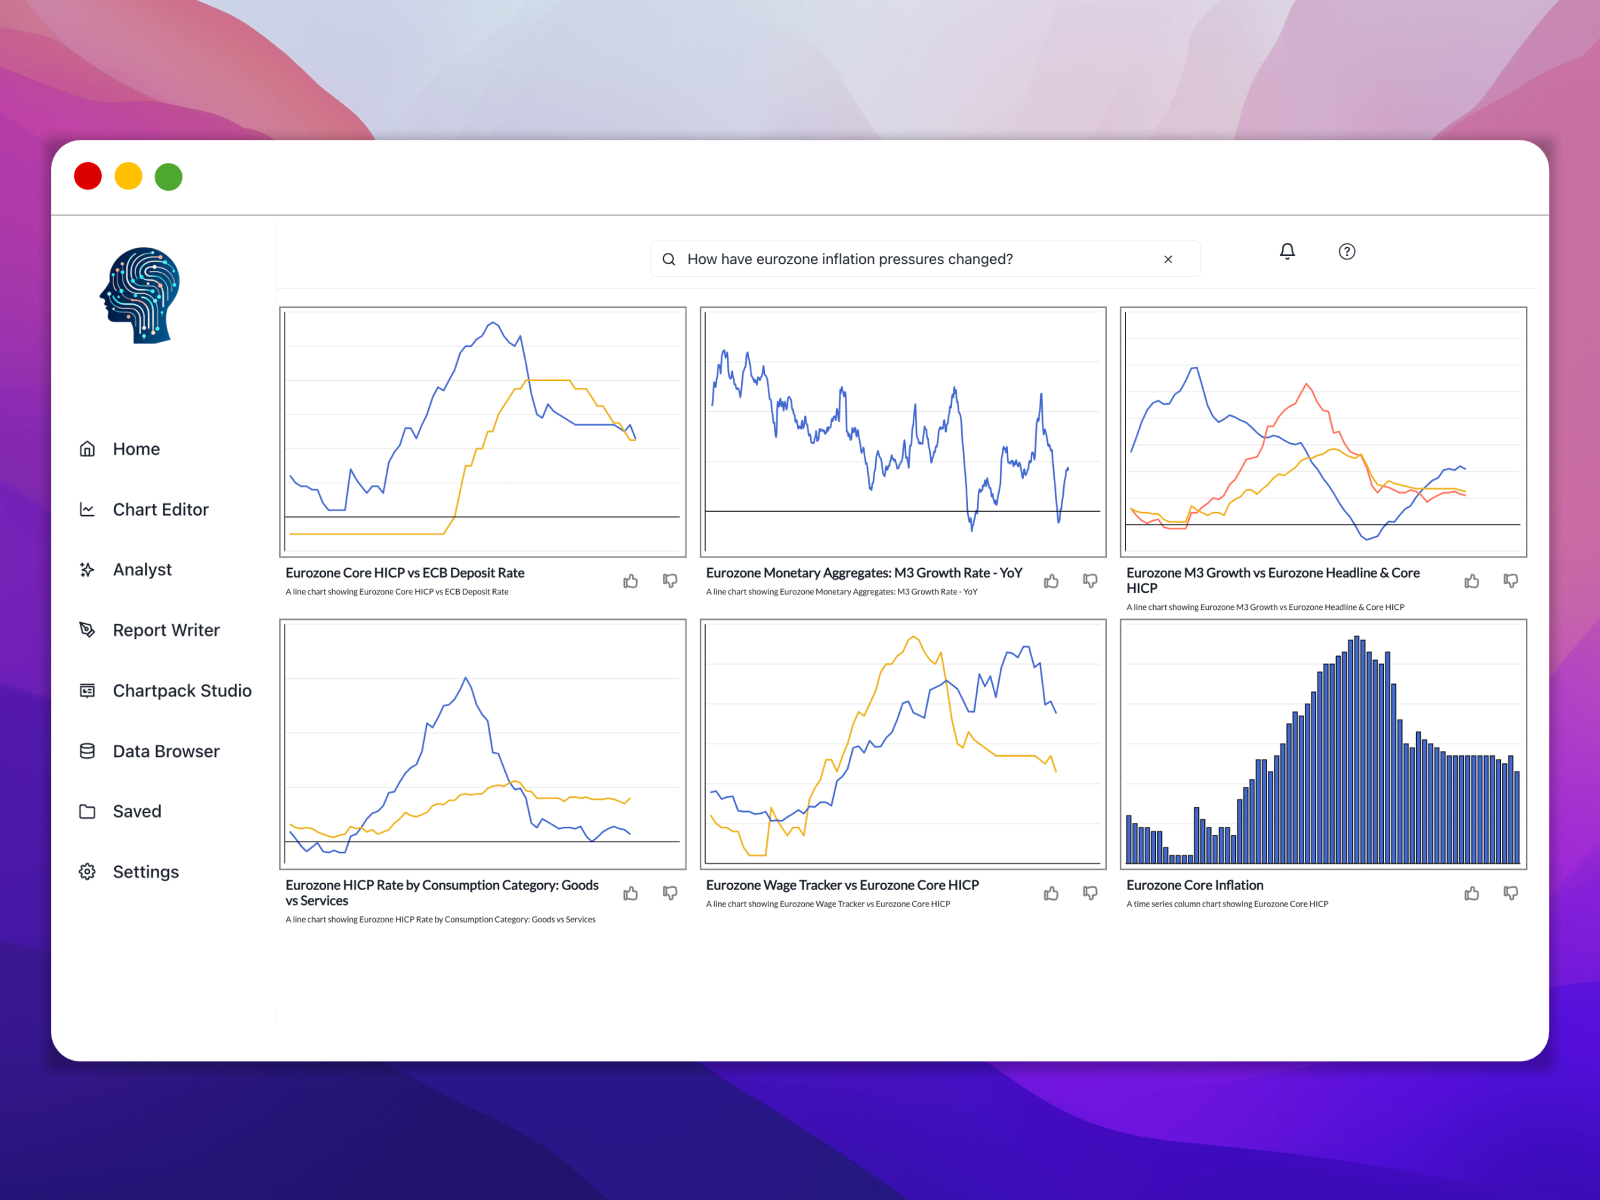
Natural language chart generation
Zola allows users to generate charts directly from text-based questions:
Type or speak a question (e.g., “S&P 500 vs inflation-adjusted earnings since 2010”)
Zola parses the request and returns a fully formatted, ready-to-use visualization
Charts are customizable, downloadable, and client-ready
This drastically reduces the time spent building and formatting visuals in Excel or PowerPoint.
AI agents for financial analysis tasks
Specialized AI agents can take on complex, multi-step workflows:
Automate data retrieval, cleaning, and analysis
Simulate the decision-making logic of experienced financial analysts
Execute repeatable research processes without scripting
These agents help users delegate time-consuming analytical work without requiring coding or training in data science.
Live reports and collaborative chartpacks
Zola enables teams to move beyond static documents:
Create live, auto-updating reports that reflect the latest data
Collaborate in real time with colleagues through shared chartpacks
Embed or export reports for external stakeholders
This feature supports alignment across departments while maintaining version control and data consistency.
Integrated data access from 100+ sources
Zola includes harmonized access to institutional-grade macroeconomic and financial datasets:
Unified interface for proprietary, public, and premium sources
Eliminates the need for multiple data subscriptions
Supports time series, cross-sectional, and forward-looking indicators
It enables users to explore diverse datasets without switching platforms or formats.
Fast performance with enterprise reliability
Zola is built for scale and speed:
Chart generation and analysis tasks are up to 10x faster than traditional tools
Available 24/7 with full support
Hosted in compliance with data privacy and security standards
Designed to serve both lean analyst teams and large enterprises with demanding workflows.
Why choose Zola?
Accelerates time-to-insight
Zola replaces manual data prep and formatting with natural language workflows, reducing hours of work to seconds.
Built by finance professionals
The platform is designed by analysts who understand the real-world bottlenecks in financial reporting and communication.
One platform for all needs
Zola eliminates the need for multiple tools and data sources, offering an integrated analytics environment.
Client-ready output by default
Visuals and reports are automatically formatted for professional presentation, removing the need for last-minute edits before client meetings.
Scalable to any team
From solo researchers to multi-country investment teams, Zola adapts to existing workflows while improving collaboration.
Zola positions itself as a next-generation solution for financial data users who want speed, reliability, and clarity without the traditional friction of legacy systems or manual reporting. Ideal for teams that need to deliver insights fast—with confidence.
Its benefits
Natural Language Chart Generation
AI-Powered Analyst Agents
Live Collaborative Chartpacks
Unified Data Ecosystem
Auto-Updating Client Materials

Zola Analytics: its rates
standard
$122.00
/month /unlimited users
Clients alternatives to Zola Analytics
Analyze network data with advanced visualization tools.
See more details See less details
Our data visualization software allows you to monitor network traffic, identify anomalies, and troubleshoot issues quickly with real-time dashboards and custom reports.
Read our analysis about Nagios Network AnalzyerCreate stunning visualizations with our data visualization software.
See more details See less details
Xtensio allows you to easily customize charts, diagrams, and infographics to clearly communicate complex data sets. With drag-and-drop functionality and a variety of templates, you can create professional-looking visualizations in minutes.
Read our analysis about XtensioCreate stunning visual representations of your data with our powerful data visualization software.
See more details See less details
Our software offers a wide range of customization options to help you create unique and interactive charts, graphs, and dashboards. With real-time data updates and seamless integration with other applications, you can easily share your visualizations with your team and clients.
Read our analysis about ZingChart Appvizer Community Reviews (0) The reviews left on Appvizer are verified by our team to ensure the authenticity of their submitters.
Write a review No reviews, be the first to submit yours.