Dynatrace : Optimize Performance with Advanced Monitoring Solutions
Dynatrace: in summary
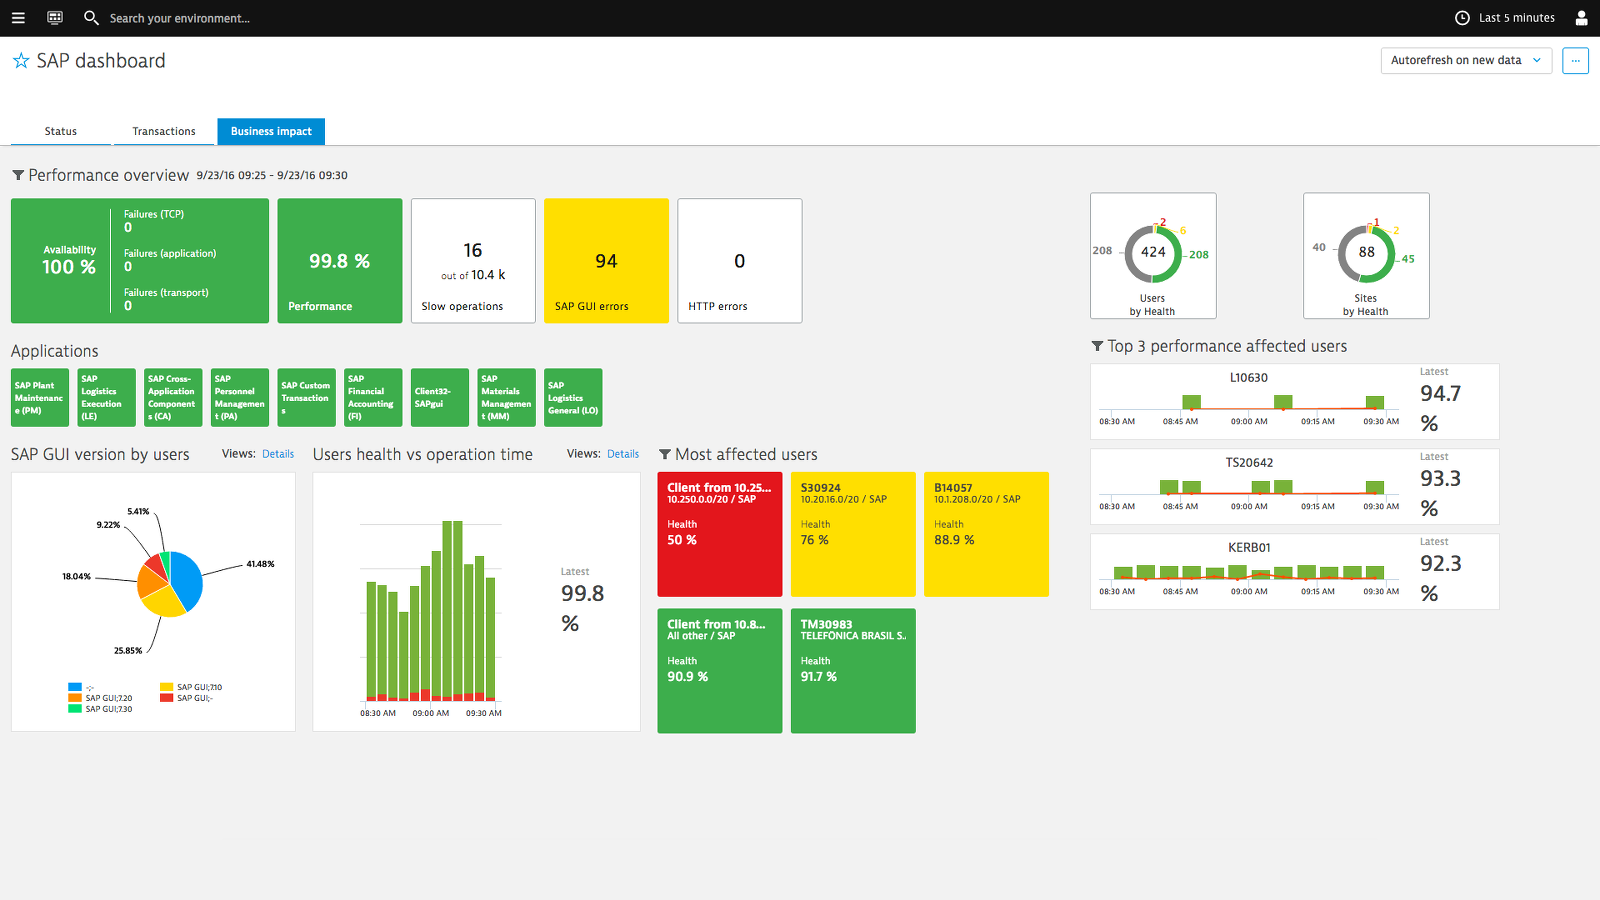
Dynatrace is a comprehensive monitoring software designed for IT operations teams and developers. It provides real-time insights into application performance and infrastructure. Key features include AI-driven problem detection, full-stack observability, and cloud-native scalability.
What are the main features of Dynatrace?
AI-Driven Problem Detection
Dynatrace leverages sophisticated artificial intelligence to autonomously detect performance issues and pinpoint their root causes. This feature eliminates the need for manual intervention and speeds up troubleshooting processes for IT teams.
- Automatic anomaly detection
- Root cause analysis powered by AI
- Predictive problem-solving capabilities
Full-Stack Observability
With its full-stack observability, Dynatrace ensures comprehensive monitoring across all components of an application ecosystem. This results in improved understanding and management of software and infrastructure behavior.
- End-to-end monitoring from front-end to back-end
- Complete visibility into hybrid cloud environments
- Integrations with popular DevOps tools
Cloud-Native Scalability
Designed for modern IT landscapes, Dynatrace offers cloud-native scalability to accommodate growing and dynamic infrastructures. This makes it the perfect fit for organizations transitioning to or operating in cloud environments.
- Auto-scaling capabilities
- Support for containerized applications
- Detailed cloud infrastructure insights
Its benefits
Provided by SCC
Dynatrace: its rates
standard
Rate
On demand
Clients alternatives to Dynatrace
Monitor your website's performance and uptime with ease using this software. Receive instant alerts when issues arise and enjoy comprehensive reporting tools.
See more details See less details
With this website monitoring software, you can track website response time, analyze server performance, and monitor user experience. Its intuitive dashboard and customizable alerts make it easy to stay on top of any issues that may arise. Plus, detailed reports provide valuable insights for future optimization.
Read our analysis about Site24x7Benefits of Site24x7
Unified Monitoring Across All IT Layers
Real-Time Insights and Proactive Issue Detection
Scalability and Multi-Tenancy for MSPs and Enterprises
Comprehensive network monitoring software with real-time alerts, customizable dashboards, and intuitive UI.
See more details See less details
ManageEngine OpManager provides complete visibility into network performance, including advanced analytics for proactive troubleshooting. With its scalable architecture, it can monitor even the largest networks with ease. Its automation and integration capabilities enable IT teams to streamline their workflows and reduce downtime.
Read our analysis about ManageEngine OpManagerBenefits of ManageEngine OpManager
Comprehensive network monitoring
Physical and virtual server monitoring
Intelligent alerting
Monitor and optimize your applications with ease using this software.
See more details See less details
Gain real-time insights into application performance, identify issues before they affect users, and streamline troubleshooting with this powerful application monitoring and performance software.
Read our analysis about GSX Gizmo Appvizer Community Reviews (0) The reviews left on Appvizer are verified by our team to ensure the authenticity of their submitters.
Write a review No reviews, be the first to submit yours.