XRebel : Effortless Java Profiling and Debugging Tool
XRebel: in summary
XRebel is a powerful Java profiling and debugging tool designed for developers who need real-time insights into their application performance. It stands out with its lightweight deployment, detailed performance metrics, and seamless integration with existing development tools, empowering developers to optimize their code efficiently.
What are the main features of XRebel?
Real-Time Application Profiling
XRebel's real-time profiling feature allows developers to monitor their application's performance as they code. This feature is essential for identifying bottlenecks and improving code quality.
- Provides instant feedback on code changes
- Measures application response times and memory usage
- Tracks HTTP requests and database queries
Lightweight and Non-Intrusive
XRebel is designed to be lightweight and non-intrusive, ensuring that it doesn't interfere with the application being developed. This allows developers to focus on coding without performance overhead.
- Easily integrates into existing development environments
- Minimal impact on application performance during profiling
- Quick setup for immediate productivity
Seamless Tool Integration
XRebel offers seamless integration with popular development tools, enhancing the overall development workflow. Developers can use XRebel alongside their preferred tools without disruption.
- Supports integration with IntelliJ IDEA and Eclipse
- Compatible with JRebel for enhanced productivity
- Works well with build automation tools like Maven and Gradle
 XRebel - XRebel-screenshot-0
 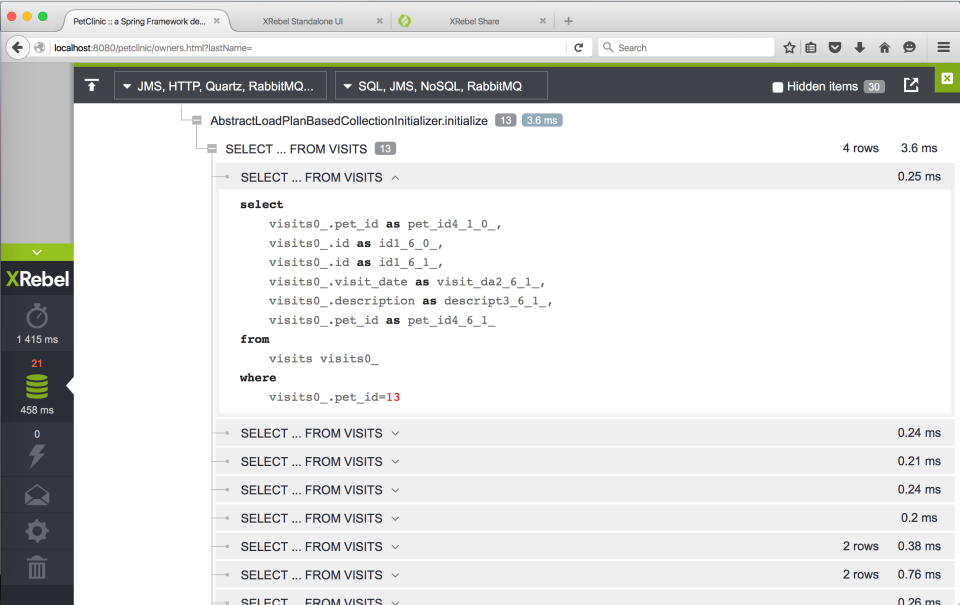 XRebel - XRebel-screenshot-1
 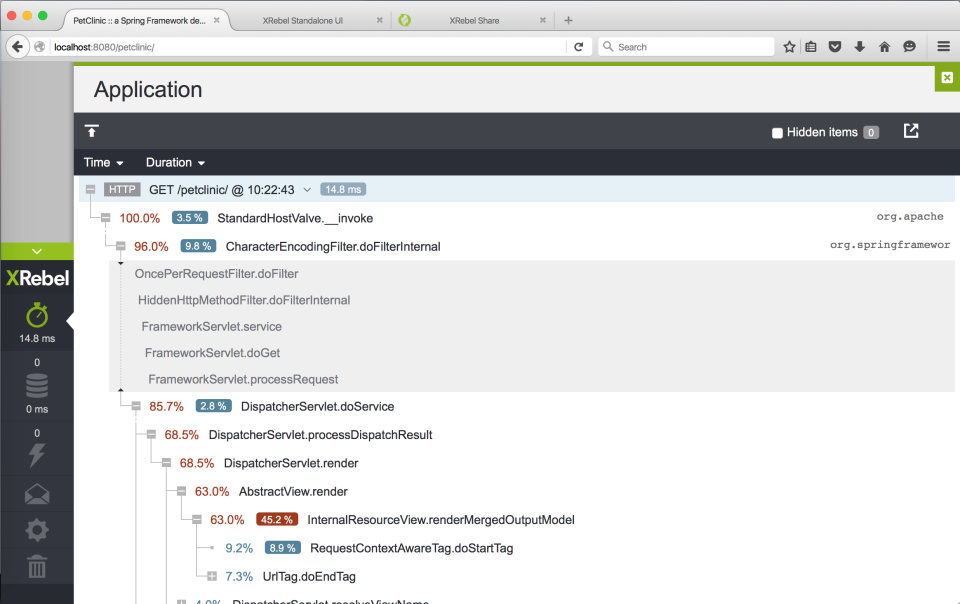 XRebel - XRebel-screenshot-2
 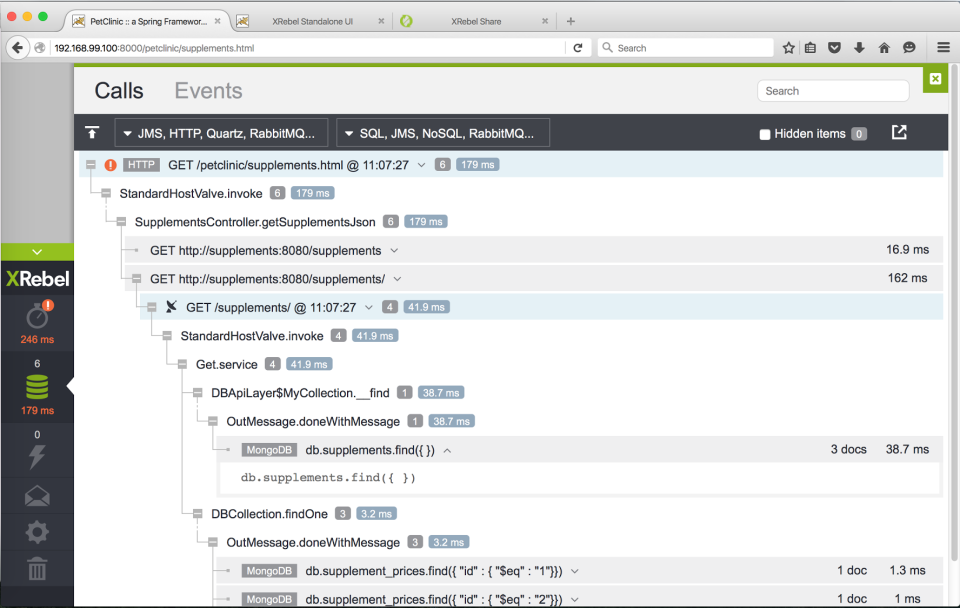 XRebel - XRebel-screenshot-3
 XRebel: its rates
standard
Rate
On demand
Clients alternatives to XRebel
Monitor your website's performance and uptime with ease using this software. Receive instant alerts when issues arise and enjoy comprehensive reporting tools.
See more details See less details
With this website monitoring software, you can track website response time, analyze server performance, and monitor user experience. Its intuitive dashboard and customizable alerts make it easy to stay on top of any issues that may arise. Plus, detailed reports provide valuable insights for future optimization.
Read our analysis about Site24x7Benefits of Site24x7
Unified Monitoring Across All IT Layers
Real-Time Insights and Proactive Issue Detection
Scalability and Multi-Tenancy for MSPs and Enterprises
Comprehensive network monitoring software with real-time alerts, customizable dashboards, and intuitive UI.
See more details See less details
ManageEngine OpManager provides complete visibility into network performance, including advanced analytics for proactive troubleshooting. With its scalable architecture, it can monitor even the largest networks with ease. Its automation and integration capabilities enable IT teams to streamline their workflows and reduce downtime.
Read our analysis about ManageEngine OpManagerBenefits of ManageEngine OpManager
Comprehensive network monitoring
Physical and virtual server monitoring
Intelligent alerting
Monitor and optimize your applications with ease using this software.
See more details See less details
Gain real-time insights into application performance, identify issues before they affect users, and streamline troubleshooting with this powerful application monitoring and performance software.
Read our analysis about GSX Gizmo Appvizer Community Reviews (0) The reviews left on Appvizer are verified by our team to ensure the authenticity of their submitters.
Write a review No reviews, be the first to submit yours.